• Six macro trends are actively reshaping B2B credit risk in 2026: bankruptcies at decade highs, sustained high rates, the CRE refinancing wall, tariff volatility, AI disruption to white-collar industries, and the subchapter V small-business surge.
• Chapter 11 filings hit a 10-year high in 2025 and February 2026 commercial filings were up 67% year over year. Real estate, consumer goods, and energy/industrial drove 80% of restructuring activity.
• The most useful macro indicators are free. Epiq AACER bankruptcy data, Fed rate signals, BLS labor data, and Trepp CRE data give you most of what you need without a paid subscription.
• Translate macro into micro. The point of macro monitoring is to identify which of your customers sit in the path of each trend, not to predict the economy.
Direct Answer
Six macro trends matter most for B2B credit teams in 2026: elevated bankruptcy velocity, the higher-for-longer interest rate environment, the commercial real estate refinancing wall, tariff and trade policy volatility, AI disruption to specific white-collar industries, and the surge in subchapter V small business filings. Each trend creates concentrated risk in specific sectors. The job isn't to forecast the economy. The job is to identify which of your customers sit in the path of each trend.
Most credit teams over-monitor headlines and under-monitor the data underneath them. A finance leader who reads the Wall Street Journal every morning isn't necessarily better informed than one who checks Epiq AACER's monthly bankruptcy report and the latest FOMC statement. The data is freer and more actionable than the analysis written about it.
The honest framing: macro monitoring should change what you do, not just what you know. If a trend doesn't connect to a specific customer in your portfolio, it's interesting but not actionable.
The Macro Trend Heatmap
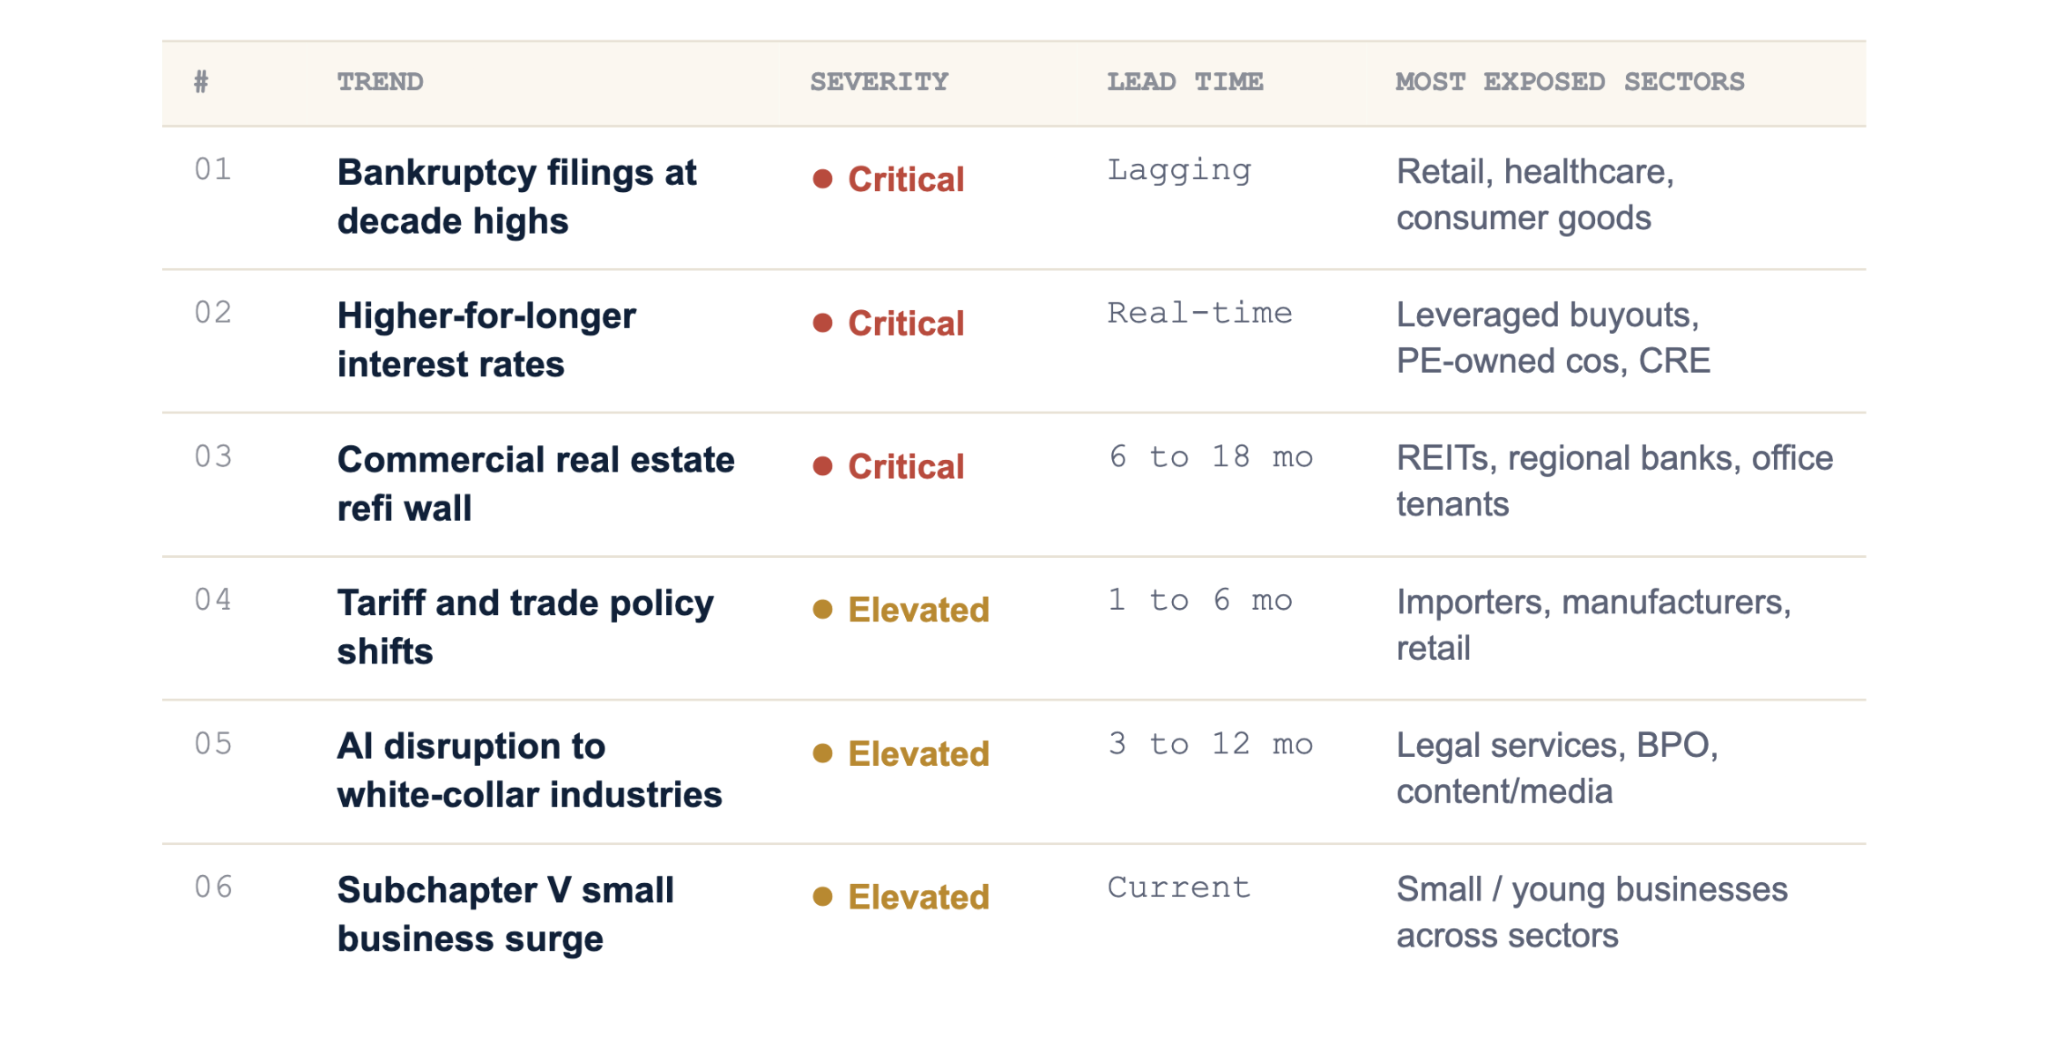
Six trends, ranked by severity for B2B credit teams. Severity reflects both probability and impact on portfolio risk.
The Six Trends in Detail
01 Bankruptcy filings at decade highs CRITICAL
US Chapter 11 filings reached a 10-year high in 2025. Q3 2025 business bankruptcy filings totaled 24,039, the highest quarterly volume since 2016. February 2026 commercial Chapter 11 filings were up 67% year over year. PwC's restructuring outlook attributes this to higher input costs, sustained borrowing pressure, and a K-shaped consumer economy. The trend matters because rising bankruptcy velocity means your portfolio's expected default rate is also rising, whether or not you can yet identify which specific customers will fail.
02 Higher-for-longer interest rates CRITICAL
Loan default rates averaged 4.3% in 2025, against pre-pandemic norms of 2 to 3 percent. The Fed's sustained higher-rate stance keeps debt service costs elevated for floating-rate borrowers, which disproportionately affects PE-owned portfolio companies, highly leveraged buyouts, and commercial real estate. If your customers carry floating-rate debt (visible in 10-K filings for public cos), their interest coverage ratios have likely compressed. Customer health and rate environment are tightly linked through this channel.
03 Commercial real estate refi wall CRITICAL
A wave of commercial real estate loans matures through 2027. Office vacancy remains elevated, and properties refinancing into the current rate environment face significantly higher debt service. The second-order effects spread beyond REITs: regional banks heavily exposed to CRE face capital pressure, and office tenants face landlord financial stress. If your customers are in commercial real estate, real estate services, or regional banking, this is your most concentrated risk.
04 Tariff and trade policy volatility ELEVATED
New tariffs and trade restrictions implemented in 2024-2025 continue to work through supply chains. Importers face direct margin pressure from higher input costs. Manufacturers with cross-border supply chains face complexity and potential disruption. The impact is more diffuse than bankruptcy data but shows up in specific industries: consumer goods importers, electronics, auto parts, apparel. Watch the USTR announcements and container shipping rate data.
05 AI disruption to white-collar industries ELEVATED
AI-driven displacement is now measurable in specific industries: legal services (document review, paralegal work), customer service and BPO, content and media production, and increasingly in software engineering. For B2B credit teams, the relevant question isn't whether AI displaces jobs broadly, but whether your customers' business models are being structurally disrupted. A law firm losing 30% of its associate billable hours to AI is a different credit risk than it was two years ago. Industry-specific revenue trends matter.
06 Subchapter V small business surge ELEVATED
Subchapter V filings (small business Chapter 11) more than doubled since 2020. February 2026 subchapter V elections were up 91% year over year. The expanded eligibility threshold and lower legal costs have made it accessible to smaller distressed businesses. If your portfolio includes small B2B customers (under $7.5M in non-contingent debt), the practical bankruptcy threshold is lower than it used to be. The signal: small business financial stress is being expressed through bankruptcy more often, not less.
Industry Exposure Map
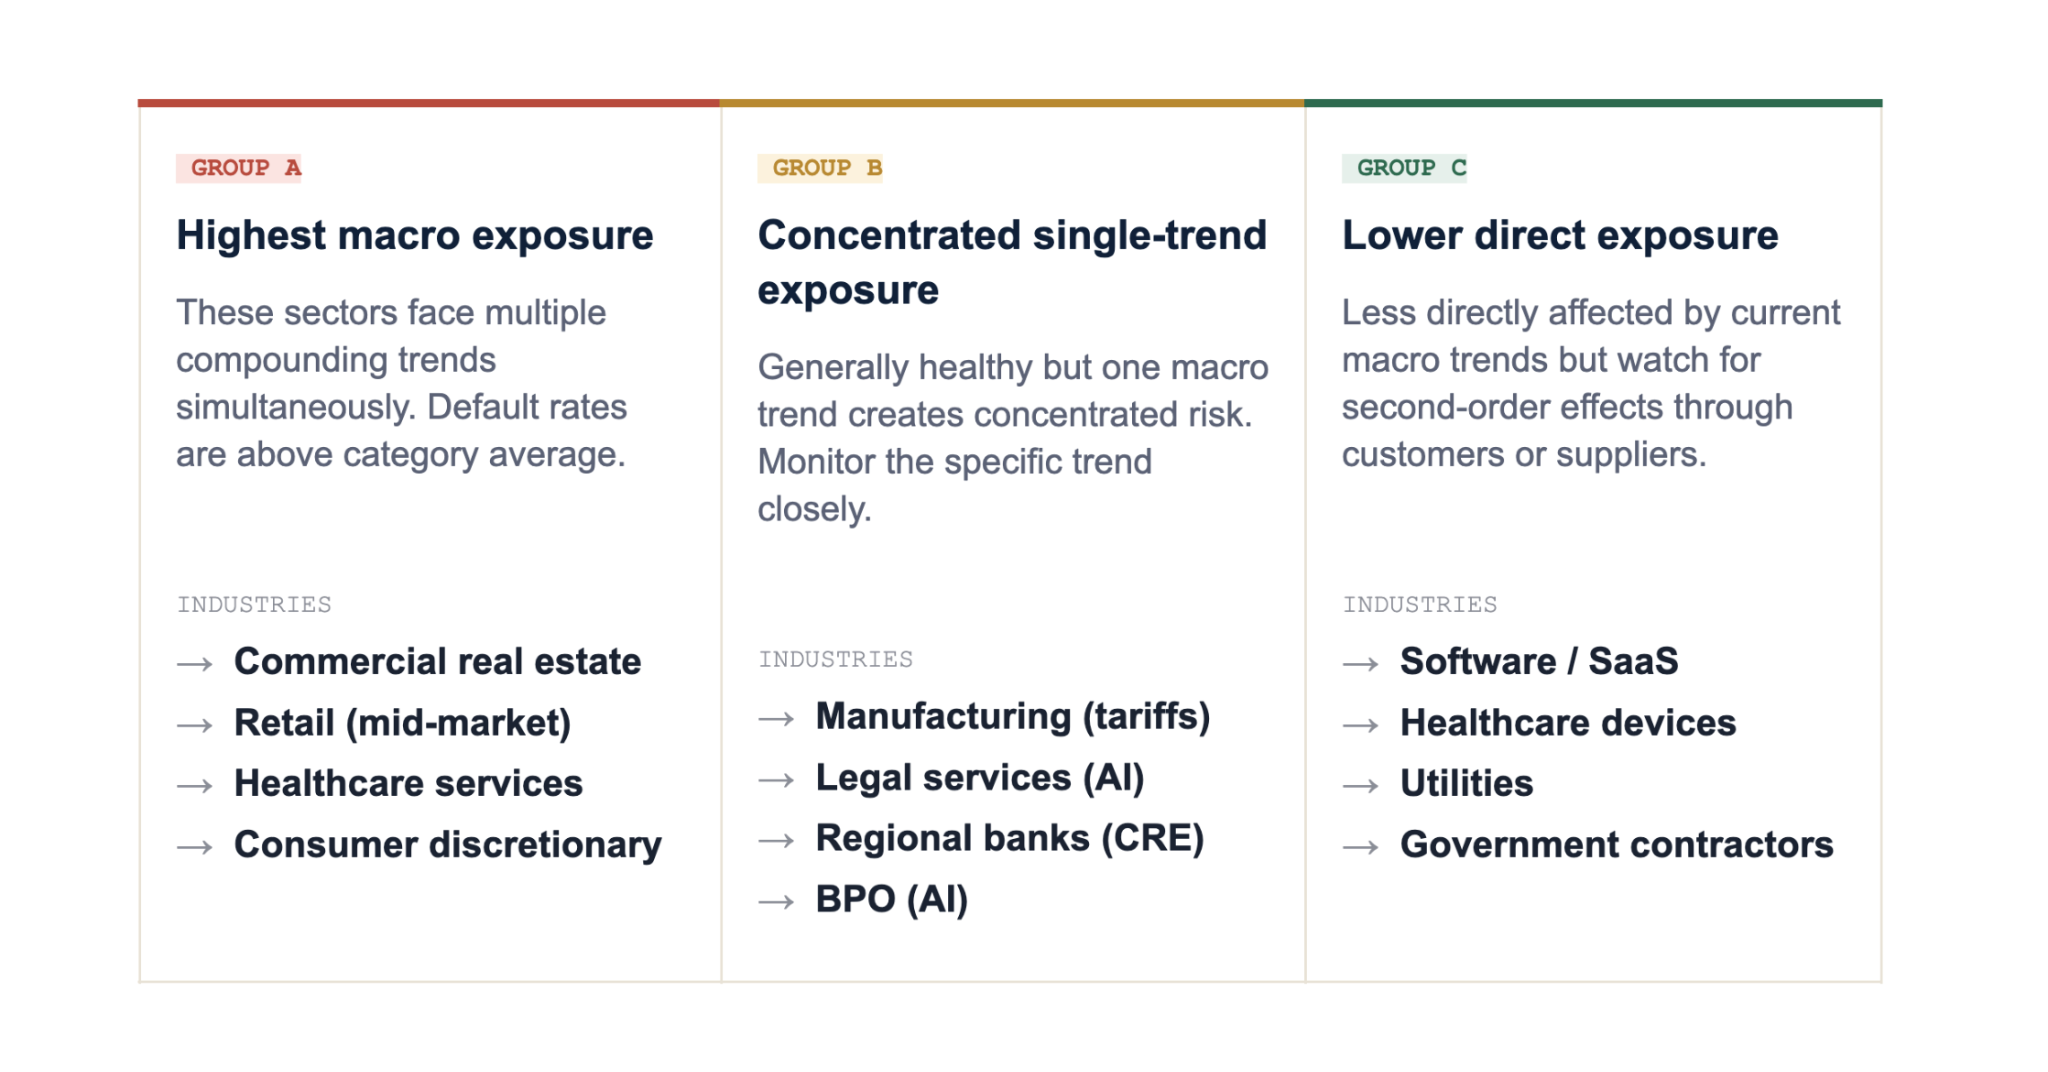
Most macro trends concentrate in specific industries. Use this map to identify which trends matter most for your customer base.
Frequently Asked Questions
Why are bankruptcy filings rising in 2025-2026?
Three converging pressures: sustained high interest rates raising debt service costs, persistent inflation pressuring margins, and the end of pandemic-era liquidity that was propping up marginal businesses. PwC's restructuring outlook and Epiq AACER data both show Chapter 11 filings at decade highs. The trend is documented, not a forecast.
Which macro trend matters most for my B2B portfolio?
Depends entirely on your customer concentration. If your top customers are in commercial real estate, the CRE refi wall is most material. If they're in consumer discretionary or retail, the bankruptcy trend is most material. The most-cited macro trend isn't the same as the trend most relevant to you. Map your customers to the heatmap above.
How often should finance teams review macro trends?
Monthly is the practical cadence. Quarterly is too slow when bankruptcy filings, rate signals, and trade policy can shift materially within weeks. Weekly is overkill unless you have very large exposures in a fast-moving sector. Build a 30-minute monthly review using the free sources listed above.
Can macro trends predict individual customer failure?
Not directly. Macro trends shift the base rate of default in specific sectors. They tell you which customers face elevated probability, not which specific customers will fail. Combine macro monitoring with customer-level monitoring (payment behavior, news, LinkedIn signals) for actionable risk assessment.
Are these trends US-specific or global?
The data points cited are US, but most of the underlying trends apply globally with regional variation. European credit teams face their own CRE wall and a different rate trajectory. UK and EU bankruptcy data tells a similar story to the US. The framework transfers; the specific data sources change by geography.
How do I translate macro monitoring into credit decisions?
Two practical changes. First, adjust credit limits down for customers in high-exposure sectors even before customer-specific signals appear. Second, increase monitoring frequency for those customers. The macro trend doesn't change the decision rule, but it changes which customers need closer attention.
Summary
• Six macro trends are materially affecting B2B credit risk in 2026: bankruptcies at decade highs, sustained high rates, CRE refi wall, tariffs, AI disruption, and subchapter V small business surge.
• Map customers to trends, not the other way around. The job is identifying which customers sit in the path of each trend, not predicting the macro environment itself.
• Most useful macro data is free. Epiq AACER, FOMC statements, BLS labor data, Trepp CRE data, USTR announcements. Build a 30-minute monthly review around these sources.