• Continuous credit risk monitoring is the ongoing capture of customer health signals (credit data, payment behavior, news, behavioral signals) with alerts fired when patterns indicate change, rather than periodic snapshot reviews.
• It differs from periodic monitoring (quarterly reviews, on-demand reports) primarily in detection lag. Continuous catches deterioration in minutes to hours. Periodic catches it weeks or months later.
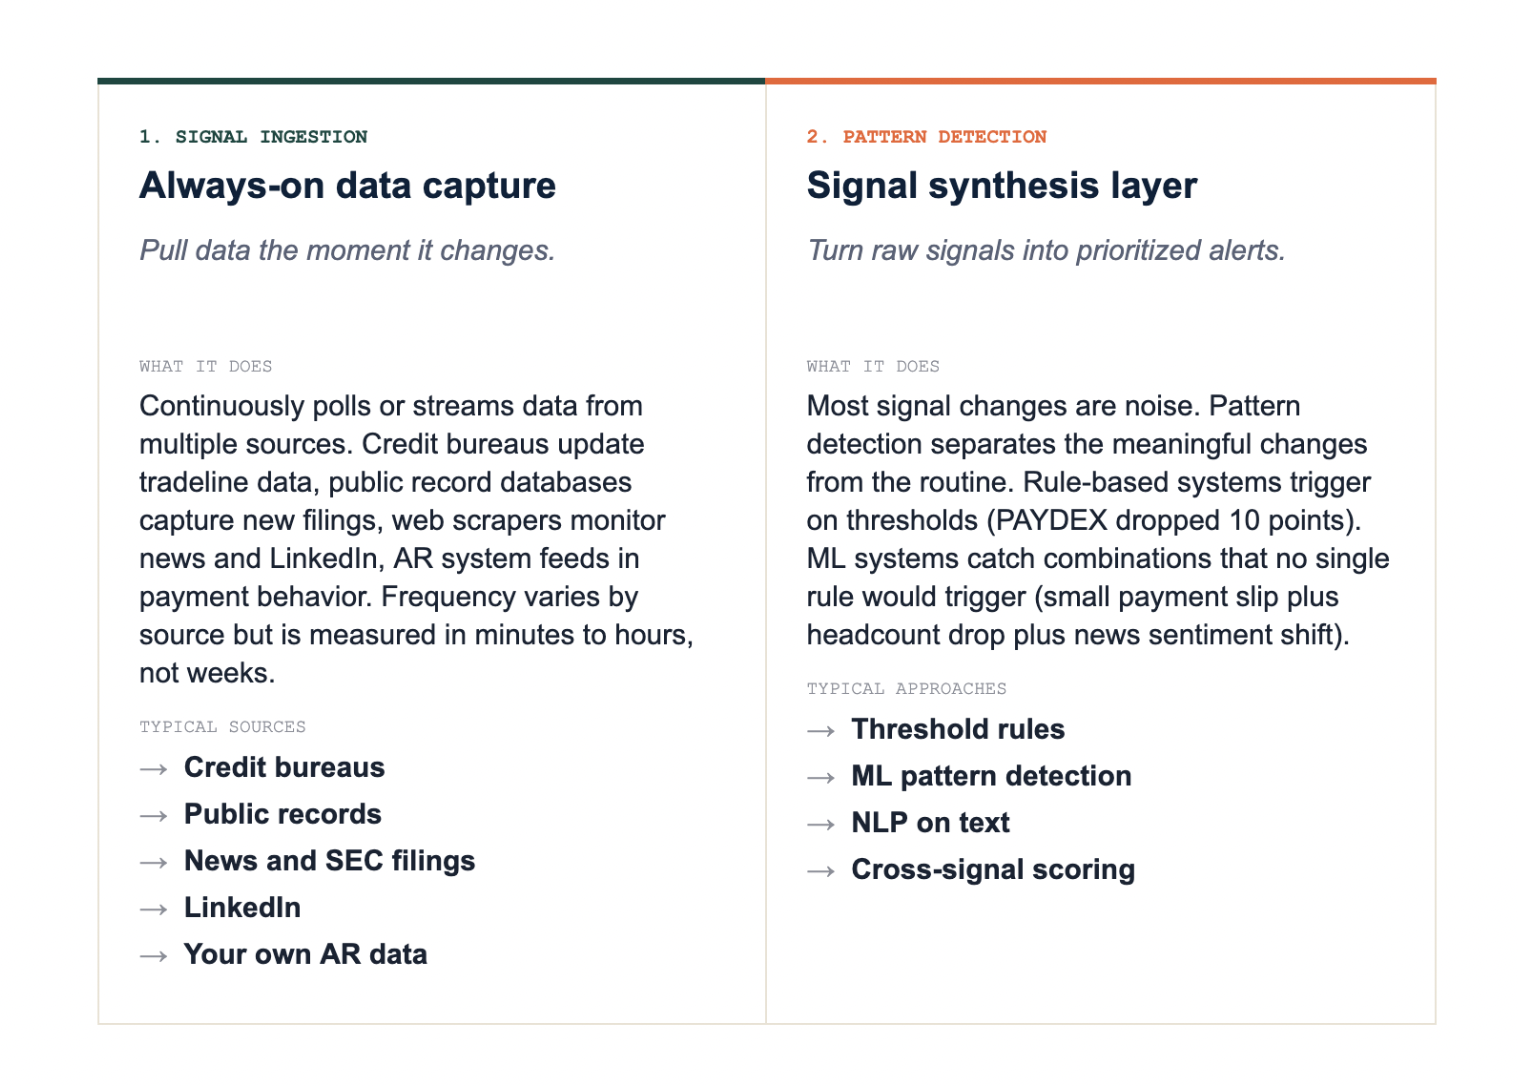
• The technical components are signal ingestion (real-time data sources), pattern detection (rules or ML), and prioritized alerting (so analysts see what matters without being flooded).
• Documented impact: 5 to 10 days of DSO reduction, 18 to 20% reduction in bad debt write-offs, and 60 to 180 days of lead time on customer deterioration when behavioral signals are included.
Direct Answer
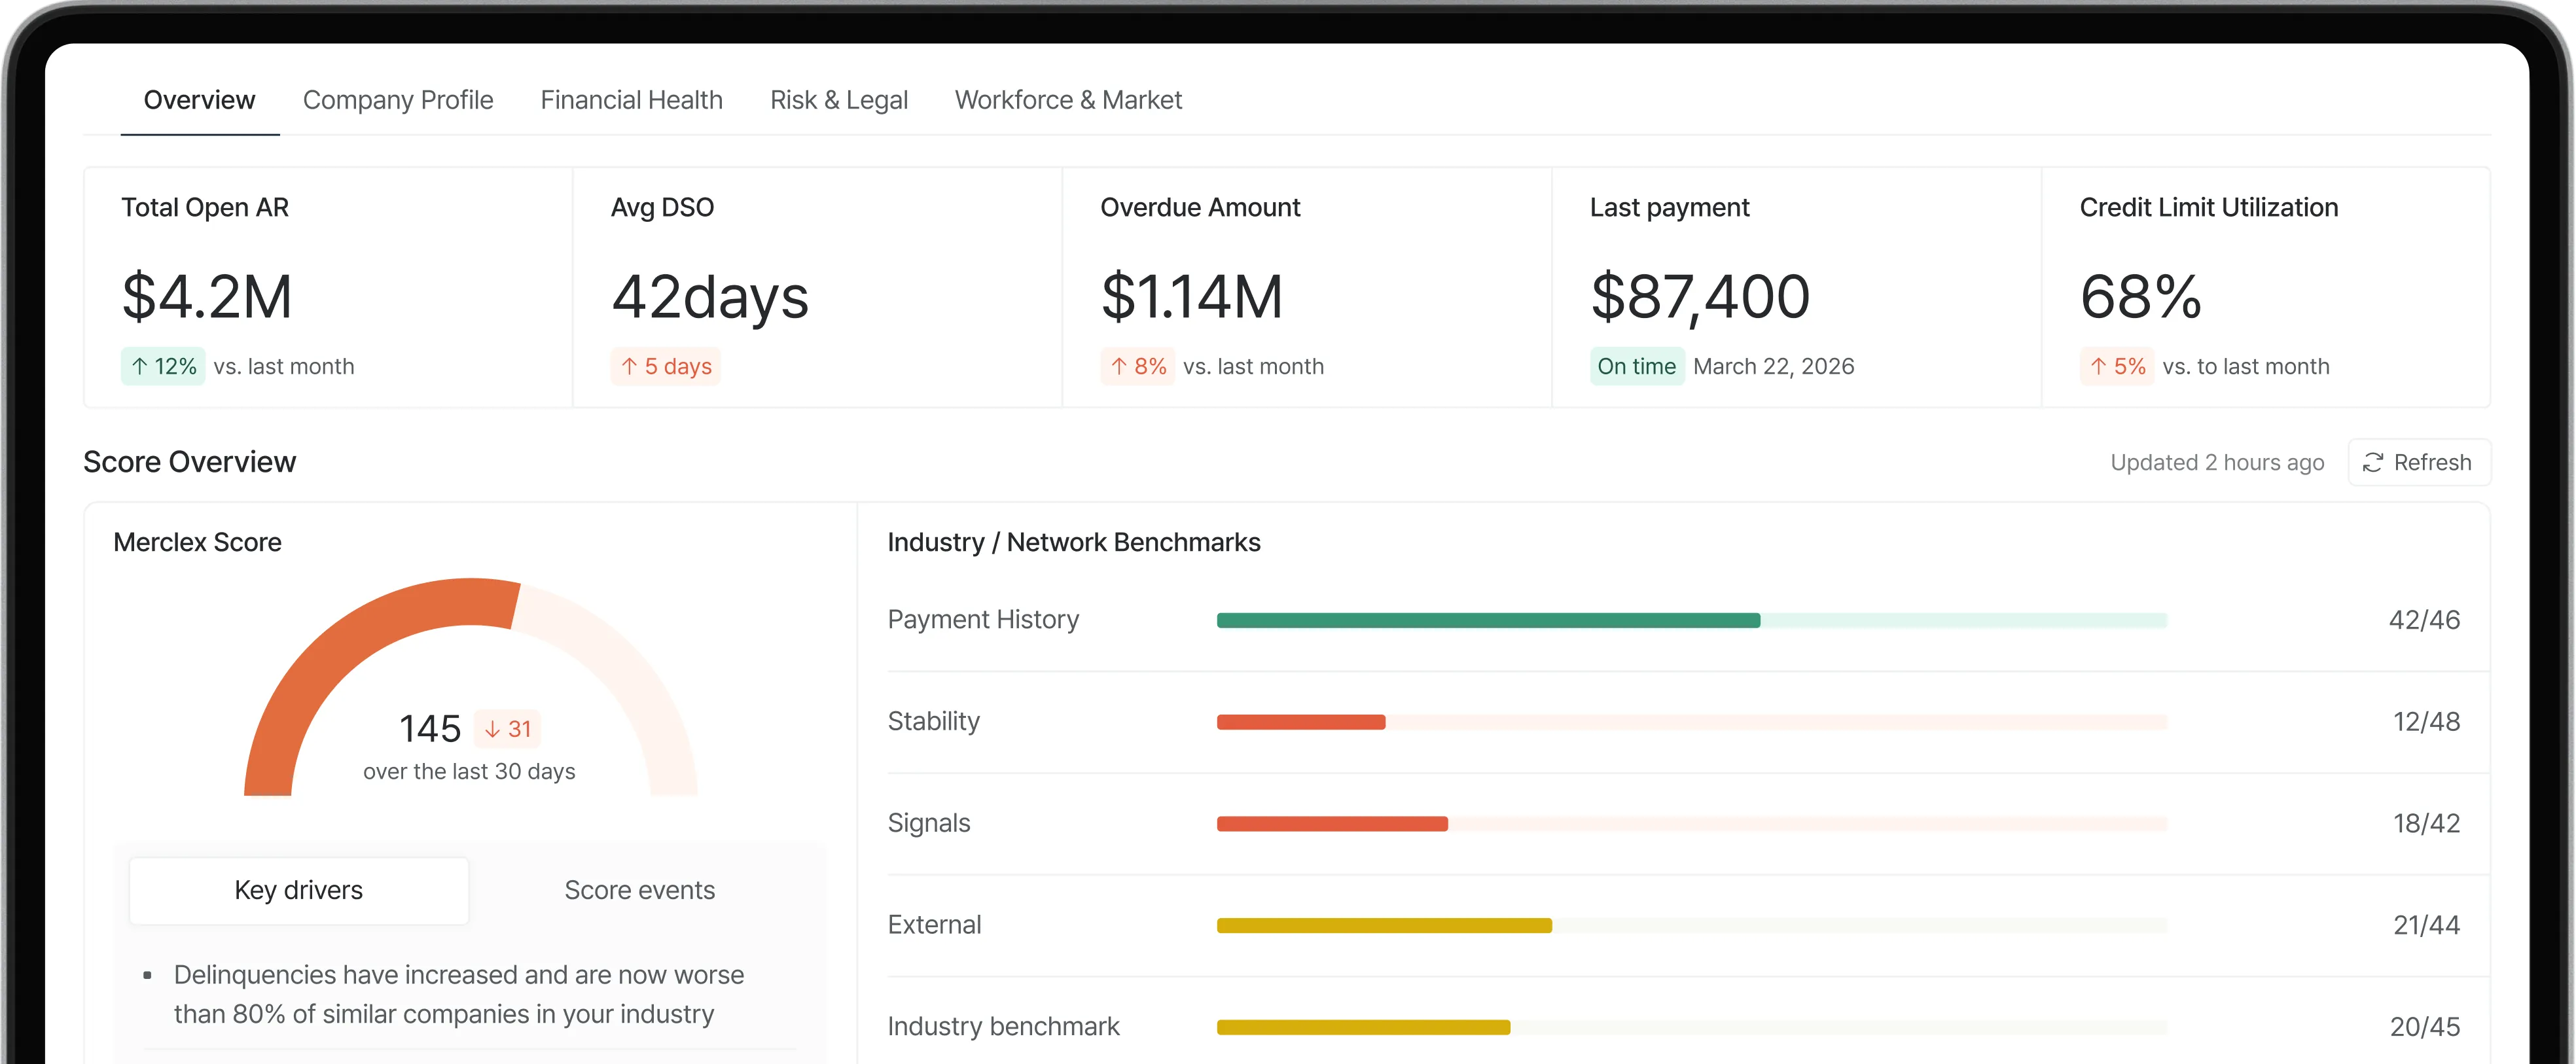
Continuous credit risk monitoring is the practice of capturing customer health signals on an ongoing basis (rather than at periodic review intervals) and firing alerts to credit and finance teams when those signals indicate meaningful change. The signals typically include traditional credit data (PAYDEX, FRISK Score, public records), payment behavior data (DBT trend, dispute patterns), and behavioral signals (LinkedIn headcount, news sentiment, earnings call language).
The structural difference from periodic monitoring is detection lag. A quarterly credit review catches a deteriorating customer up to 90 days after deterioration started. Continuous monitoring catches the same deterioration in minutes to hours, which gives the credit team meaningful runway to act.
The documented business impact is consistent across published research: Financial Models Lab reports an 18% reduction in bad debt write-offs in FY 2025 from predictive credit scoring (the foundation of continuous monitoring). HighRadius customer data documents a 5.5-day DSO reduction from AI-prioritized worklists. Resolve's analysis puts the combined AR automation plus predictive monitoring impact at up to 30% bad debt reduction.
Why Detection Lag Matters
A customer who goes from healthy to distressed rarely does so overnight. The deterioration typically follows a pattern: external signals shift first (LinkedIn headcount drops, leadership departures, news mentions, earnings language changes), then payment behavior shifts (DBT extends, partial payments appear), then communication patterns shift (slower email responses, escalations missed), then a missed payment.
In a periodic monitoring model, your credit team sees the same data the bureau saw at the last review point. If your last quarterly review was 45 days ago, the customer's situation in your file is 45 days stale. By the time the next review comes, the deterioration that started in week 1 has had three months to develop. The credit team's options at that point are limited to reactive collections.
In a continuous model, the same deterioration triggers an alert in week 1 when the first signal fires. The credit team has 60 to 180 days to act before any payment is actually missed, depending on which signal type fires first. That window is the whole point. It is what changes a credit team's posture from "clean up defaults" to "prevent defaults."
What Continuous Monitoring Looks Like in Practice
Three technical components, each addressing a different problem.
The Third Component: Prioritized Alerting
Signal ingestion plus pattern detection produces alerts. If those alerts arrive as an undifferentiated stream, the credit team is flooded and stops responding. The third component is prioritization: ranking alerts by urgency, confidence, and exposure size so the team sees the five that matter most this morning, not the eighty that were technically generated overnight.
Good prioritization combines three inputs. The signal strength (one weak signal is noise; three signals firing together is real). The customer's exposure (an alert on a customer with a $50K open invoice matters more than the same alert on a customer with $500). And the confidence score from the detection layer (high-precision alerts get pushed to the top; soft signals go to a watchlist).
Common Mistakes
• Treating continuous monitoring as a software purchase. The software ingests signals and fires alerts; the value only materializes when the credit team has defined responses for each alert tier. Software without that workflow is just noise generation.
• Watching only your own AR data. Continuous monitoring of payment behavior is useful but lags. The early warnings come from external signals: LinkedIn, news, public records, earnings filings. Coverage of external signals is what separates real continuous monitoring from "AR dashboards updated more frequently."
• Confusing continuous with frequent. Quarterly reviews moved to monthly are still periodic monitoring, just at a different cadence. Continuous means triggered by signal change, not by calendar.
• Ignoring false-positive cost. Early-stage deployments produce noisy alerts. The right response is threshold tuning and analyst feedback, not turning off the alerts. Most teams that abandon continuous monitoring do so 60 to 90 days in, exactly when the noise has not yet been tuned out.
• Skipping the action mapping. An alert without a defined action is anxiety. Decide in advance what each alert tier triggers: tier 1 = analyst review within 24 hours, tier 2 = watchlist, tier 3 = automated workflow. Without that mapping, alerts pile up and ignored alerts retrain the system to fire less, defeating the purpose.
Frequently Asked Questions
How is continuous credit risk monitoring different from real-time monitoring?
Real-time describes the speed of alerting (seconds to minutes after an event). Continuous describes the coverage model (ongoing, not periodic). The two terms overlap heavily in vendor marketing. A genuinely continuous monitoring platform is also real-time by definition; some platforms market real-time on a specific feature (a dashboard refresh) while still running periodic underneath. Ask about the polling cadence on each signal source to tell the difference.
Does continuous credit risk monitoring actually reduce bad debt?
Yes, with documented impact. Financial Models Lab reports 18% reduction in write-offs from predictive credit scoring (the foundation of continuous monitoring). Resolve's analysis documents up to 30% reduction when continuous monitoring is combined with AR automation. Industry-wide, Centime's DSO guide puts current US B2B bad debt write-offs at ~8% of invoices, so a 20% reduction translates to ~1.6 percentage points back on margin.
What data sources does continuous monitoring use?
Five categories. Traditional credit data (PAYDEX, FRISK, public records). Your own AR data (payment behavior, disputes, DBT trend). Public records (UCC filings, lawsuits, tax liens, judgments). Web sources (news, LinkedIn, sentiment). Filings (10-Q, 10-K, earnings call transcripts, for public companies). The depth of coverage across these five categories is the main differentiator between continuous-monitoring platforms.
What is the difference between continuous monitoring and AI credit monitoring?
AI credit monitoring is the technique; continuous monitoring is the operational model. Most continuous monitoring today uses some form of AI (pattern detection, NLP, cross-signal scoring) because the volume of signals is too large for rule-based systems to handle well. But continuous monitoring could in principle run on rules alone, just with weaker pattern detection. The two terms are increasingly used interchangeably, with AI specifically referring to the synthesis layer described in our AI credit monitoring guide.
How long does it take to implement continuous monitoring?
Implementation typically runs 2 to 8 weeks depending on platform depth. Lighter SaaS platforms with bureau API connections can be live in 2 to 3 weeks. Enterprise platforms with ERP integration and custom workflow take 6 to 8 weeks (HighRadius documents this for NetSuite specifically). Add 1 to 2 weeks for customer master data cleanup, which every implementation surfaces. Then 30 to 60 days of threshold tuning to reduce false positives before alerts become routinely actionable.
Should a small B2B business with 50 customers use continuous monitoring?
Possibly yes, depending on customer concentration. If your top 10 customers represent 60%+ of revenue, continuous monitoring on those accounts pays for itself fast. If your customer base is broad and uniform in size, the math is closer to the line. A practical heuristic: if a single customer default would cost more than $50K, continuous monitoring is probably worth it. If your largest exposure is under $10K, periodic reviews and a strong credit policy at onboarding are usually sufficient.
Can continuous monitoring replace periodic credit reviews entirely?
Mostly, but not entirely. Continuous monitoring catches change. Periodic reviews still serve two purposes that continuous monitoring does not: regulatory documentation (some industries require quarterly review records regardless of signal data) and slow-drift catches (a customer who is gradually deteriorating without any single signal firing strongly). Most mature credit teams use continuous monitoring as the primary surveillance layer and keep periodic reviews on the calendar as a portfolio-level check.
What is the operational difference for credit analysts?
Analysts in a continuous monitoring shop spend less time pulling and reviewing reports and more time on triage and action. The job shifts from data gathering to judgment. Each morning brings a prioritized list of accounts that need attention, instead of a calendar of scheduled reviews. The total number of accounts reviewed per analyst per quarter typically increases by 2 to 4 times, with quality of review going up rather than down because attention is directed by signal, not by schedule.
Summary
• Continuous credit risk monitoring captures signals on an ongoing basis and fires alerts on pattern change, rather than reviewing customers on a periodic schedule.
• Three components: signal ingestion (multiple data sources), pattern detection (rules or ML), and prioritized alerting (so analysts see what matters).
• Documented impact: 18 to 30% reduction in bad debt write-offs, 5 to 10 days of DSO reduction, and 60 to 180 days of lead time on deterioration when external behavioral signals are included.